// Guide · Claude + Fuzzframe
How to make an animated chart video with Claude
A 50-second narrated chart video, vertical, from one message and one Make it: bars that grow as the voice names them, a counter, a people grid. Here’s the brief, word for word, and how to swap in your own numbers.
6 stepsabout 30 min in the chat
You need Fuzzframe credits and a Claude plan that can add custom connectors.
In this guide · 6 steps
Who this is for, and why a chart
Anyone with a number worth explaining: a fact channel, a teacher, a newsletter, a marketer with a stat that sells. A chart that grows while a voice explains it is easier to follow than a still infographic, and a vertical one plays where people scroll.
What makes a chart video work
One pattern and one break in it. Here the pattern is the bars getting shorter, billion after billion; the break is the first bar that is longer again. Each bar arrives as the voice says its number, so the eye and the ear get the same fact at the same moment.
Connect Claude
Press Add to Claude: Claude opens with Fuzzframe already filled in, so you press Continue. Then press Connect next to Fuzzframe, sign in to Fuzzframe and press Allow. You do this once.
Add to Claude ↗Get your numbers
Before you write anything, collect the numbers from one source you can name. We used the UN’s population milestones and worked out how long each billion took from their dates. Claude uses the numbers you give it and says so when a line of the script goes beyond them.
How long did each billion take?
| Milestone | Reached | Took |
|---|---|---|
| 1 billion | around 1804 | – |
| 2 billion | 1927 | 123 years |
| 3 billion | 1960 | 33 years |
| 4 billion | 1974 | 14 years |
| 5 billion | 1987 | 13 years |
| 6 billion | 1999 | 12 years |
| 7 billion | 2011 | 12 years |
| 8 billion | 15 Nov 2022 | 11 years |
| 9 billion | around 2037 (projected) | about 15 years |
Source: United Nations, World Population Prospects. The UN projects a peak of about 10.3 billion in the mid-2080s.
Paste the brief
Start a new chat and paste one message: the topic, the headline for the first frame, which chart shows what, the numbers with their source, and the voice. That’s the whole brief.
Use Fuzzframe: call guide first and follow it. Make me an animated chart video: vertical, 45 to 60 seconds, English, narrated. Topic: [what your numbers show, in one line].
Cover headline at frame 0, verbatim, huge and readable at 0.0 s, the word in brackets in the accent colour: [your headline, with the [key word] in brackets]
Let the charts carry the story: [which chart shows what, in order, e.g. a bar for each year growing in as the voice names it; a counter ticking up; a grid of icons filling]. Then the turn: [the one number that breaks the pattern].
Data, from [source], use exactly these and nothing else: [your numbers, each with its year or label]. Put "Source: [source]" small on screen.
Voice: [e.g. a clear, calm narrator]. Music: a quiet loop under the voice.
The exact brief we used
Use Fuzzframe: call guide first and follow it. Make me an animated chart video: vertical, 45 to 60 seconds, English, narrated. Topic: how fast the world reached each billion people, and why the next billion comes slower.
Cover headline at frame 0, verbatim, huge and readable at 0.0 s, the word in brackets in the accent colour: Each billion came faster. Until [now].
Let the charts carry the story: a bar chart of how many years each billion took (123, 33, 14, 13, 12, 12, 11), each bar growing in as the voice names it; a counter ticking from 1 to 8 billion with the year beside it; an icon grid of people filling as the billions arrive. Then the turn: one new bar, about 15 years to 9 billion, longer than the last ones, and a line bending toward a peak of about 10.3 billion in the mid-2080s.
Data, from the UN, use exactly these and nothing else: 1 billion around 1804; 2 billion 1927; 3 billion 1960; 4 billion 1974; 5 billion 1987; 6 billion 1999; 7 billion 2011; 8 billion on 15 November 2022; 9 billion projected around 2037; a peak projected at about 10.3 billion in the mid-2080s. Say "projected" for the future numbers and put "Source: UN" small on screen.
Voice: a clear, calm narrator, curious, not dramatic. Music: a quiet loop under the voice.
Pick the look
Claude shows three looks and recommends one. For a chart video it picked Swiss Grid: big flush-left numbers and bars on a visible grid, with one red for the key number. We tapped it.
Used Fuzzframe, ran a command ›
 Fuzzframe · looksUnverified
Pick a look
Press a look, or tell Claude what you’d like. Like another video’s style? Share the video, a link or screenshots in the chat and Claude makes that look for you. Upload your own reference to draw a story in its style.
Claude makes the rest and shows you what it picked before anything is made. or choose each step
Upload not opening? Use the upload page ↗
The looks are above. Pick one there, or type a name, and I’ll take it from there. Your chat may ask you to allow Fuzzframe’s tools; the video waits until you press allow.
My pick is Swiss Grid. It has huge flush-left numerals and bars on a visible grid, with one red for the bracketed now and the key number in each beat. It looks authoritative, which suits UN data, and its motion is calm with no bounce, which fits your narrator. Soft Gradient is the quieter, more premium option. Color Block is bolder, with a new ground colour each scene.
If Claude asks “Allow once”
Tapping a look makes the card send a message for you (“Use the Swiss Grid look.”), and Claude may ask you to allow it. Press Allow once, or type the same words yourself.
Check the brief, press Make it
Claude writes the script, picks the voice and the music, and shows it all on one card with three ways to animate it. Its pick, the red bar of time, turns the red line under “now” into the 123-year bar, then each shorter bar slots in while the counter ticks. Nothing is recorded or charged until you press Make it.
Fuzzframe · briefUnverifiedYour video
Each billion came faster. Until now.
A motion-graphics video“Each billion came faster than the last. Until now.”
The motion · three ideas
- Look
- Swiss Grid
- Voice
- Jennica - Calm, Warm
- Length
- about 50 s
- Music
- A loop: soft piano and airy pads, calm, around 90 BPM, quiet under the voice
Claude picked these for you. Nothing is made until you press Make it; after that it goes all the way to the MP4.
Read what Claude writes under the card. Ours said which two lines went beyond our numbers, and that the peak comes from a newer UN report than the 2022 dates. We kept both and pressed Make it.
The script, as recorded
Each billion came faster than the last. Until now.
Around eighteen oh four, there were one billion people. It took all of human history to get there. The second billion took a hundred and twenty three years, arriving in nineteen twenty seven.
The third took thirty three years, by nineteen sixty. Then fourteen. Thirteen. Twelve. And twelve again.
On the fifteenth of November, twenty twenty two, just eleven years later, the world reached eight billion.
But the ninth billion is projected around twenty thirty seven, about fifteen years. For the first time, the wait gets longer.
Families are having fewer children, so growth is slowing. The UN projects a peak of about ten point three billion people, in the mid twenty eighties.
The curve that kept getting steeper is finally bending.
Get the MP4
Claude builds the film on your Claude plan and Fuzzframe checks it. When the checks find nothing wrong, it goes straight to the MP4: ours took about 23 minutes after Make it. You get the download link, a short list of what’s on screen, and three captions, one per platform. The video also stays in your Fuzzframe studio, where you can download it again.
Recording the voice and building the film now. I’ll report back with the MP4.
Used Fuzzframe, ran 2 commands ›
Your video is finished: 49 seconds, vertical, in Swiss Grid, narrated by Jennica with a quiet piano loop underneath.
Download the MP4. The link expires in about 6 hours. The video stays in your Fuzzframe studio, where you can watch it with sound and download it again later.
Fuzzframe’s automatic checks found no problems, so I exported it without a draft review.
What’s on screen
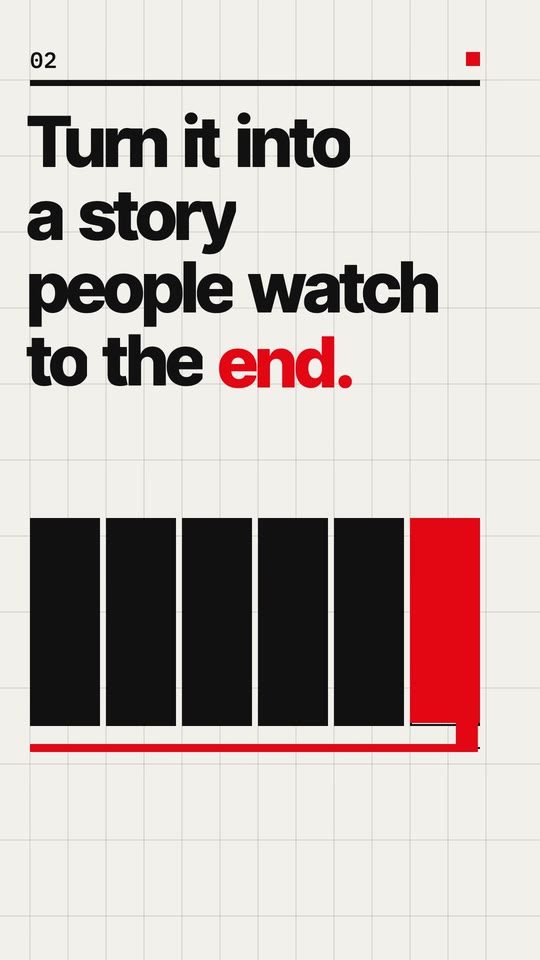
- Cover: your headline is fully readable at 0.0 s, with “now” in red and underlined. The finished bar chart sits below it, and “SOURCE: UN” stays small at the top for the whole film.
Make it yours
- Your numbers: any series that changes over time works: prices by year, members by month, a record falling. Give each number its year or label.
- The turn: find the one number that breaks the pattern and put it last. That’s what people stay for.
- The source: name it in the brief and on screen. Claude will tell you if a line says more than your numbers do.
- The look: Swiss Grid suits data. For something warmer, ask for Soft Gradient; for louder, Color Block.
Questions
Can Claude make videos?
Is this a bar chart race?
What does it cost?
How long did it take?
Can I use my own numbers?
Other languages?
Ready to make yours?
Connect Claude once, then every video starts with one message.
Connect Claude